
 By zynmag
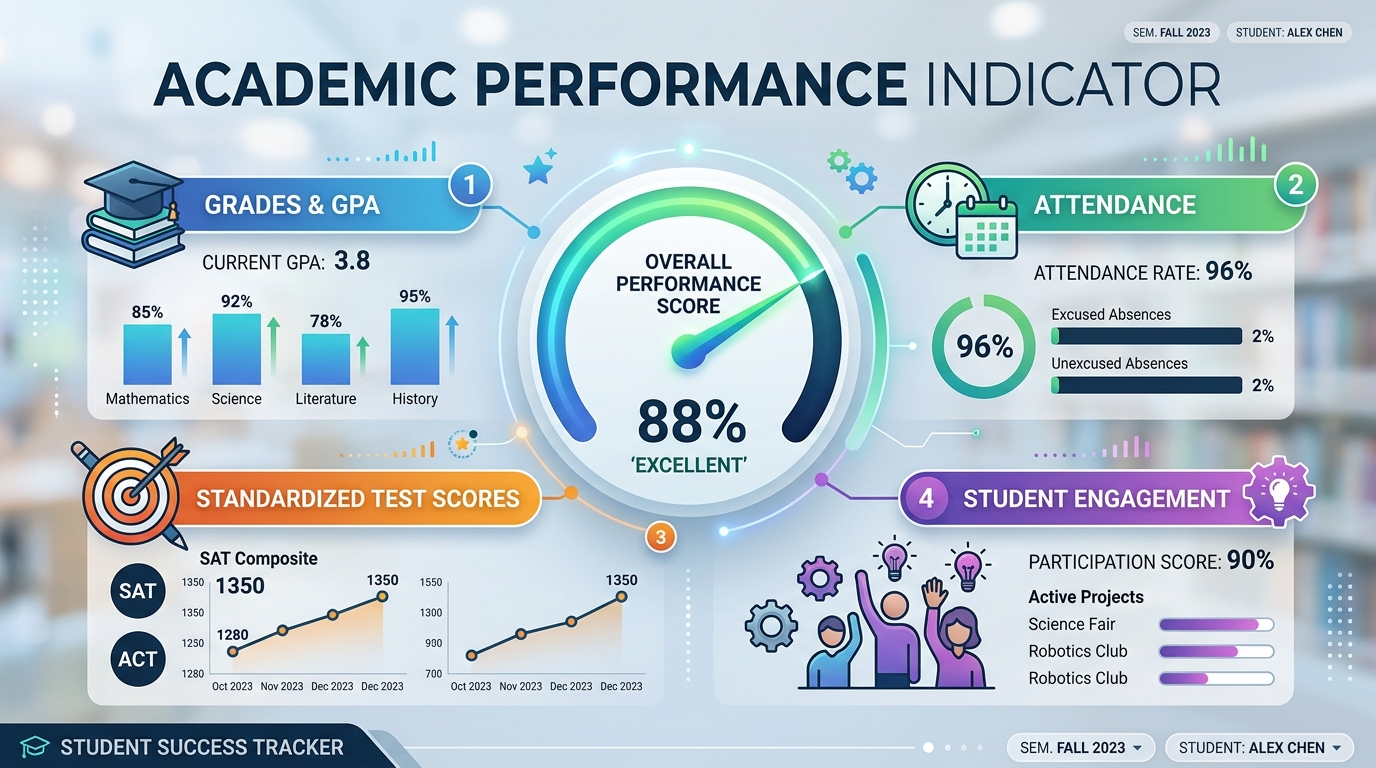
Every school, teacher, and parent eventually asks one question: how well are students actually learning? An Academic Performance Indicator answers that question by turning classroom outcomes into measurable data. Consequently, schools can identify gaps early and adjust teaching methods before problems grow. Furthermore, these indicators help administrators compare progress across grades, subjects, and even entire districts. As education systems become more data-driven, understanding these indicators matters more than ever for teachers, students, and policymakers alike.
What Is an Academic Performance Indicator?
An Academic Performance Indicator refers to a measurable value that reflects a student’s academic achievement over a specific period. Typically, schools calculate it using test scores, assignment grades, attendance records, and classroom participation. Additionally, some institutions include behavioral metrics and extracurricular involvement in their calculations. Because these indicators combine multiple data points, they offer a fuller picture than a single exam score. Therefore, educators rely on them to spot patterns that a single test might miss entirely. In essence, this metric transforms scattered academic data into one coherent, actionable number.
Why These Indicators Matter in Modern Education
Modern classrooms generate enormous amounts of data every single day. However, raw data alone rarely tells teachers what actions they should take next. This is where structured indicators prove their real value to educators and administrators. Specifically, they highlight which students need extra support before final exams arrive. Moreover, they reveal whether a teaching method is genuinely working across an entire classroom. Without such indicators, schools would struggle to make informed, timely decisions about curriculum design. As a result, many education systems now treat these metrics as essential planning tools rather than optional extras.
Supporting Early Intervention
One major benefit involves catching struggling students long before they fail a course. For instance, a declining indicator score might reveal a student needs tutoring immediately. Meanwhile, teachers can adjust lesson pacing based on real-time performance trends across the class. In addition, counselors use this data to schedule check-ins with students showing early warning signs. Consequently, schools shift from reactive discipline toward proactive academic support strategies. This shift ultimately benefits students who might otherwise slip through the cracks unnoticed.
Guiding Resource Allocation
Schools operate with limited budgets, so administrators must prioritize spending carefully every year. Performance data helps leadership decide where tutoring programs, staff training, or new materials are needed most. For example, a school might discover that math scores lag significantly behind reading scores district-wide. Subsequently, funding gets redirected toward math specialists and updated instructional resources. Without this insight, resources might get allocated based on guesswork rather than evidence. Thus, data-driven decisions tend to produce better outcomes than intuition alone.
Common Metrics Used to Calculate Performance
Several distinct metrics typically combine to form a complete performance picture for students. Test scores remain the most traditional and widely recognized component of this calculation. However, relying solely on exams ignores other important aspects of student growth and effort. Therefore, many systems also weigh homework completion rates and classroom engagement levels. Attendance is another critical factor, since consistent presence strongly correlates with academic success. Additionally, some frameworks incorporate peer collaboration scores and project-based assessment results. Ultimately, the specific mix of metrics depends heavily on institutional goals and available resources.
Standardized Test Scores
Standardized tests offer a consistent benchmark for comparing students across different schools and regions. Because these tests use identical questions, they reduce bias from individual teacher grading styles. Nevertheless, critics argue that standardized tests fail to capture creativity or critical thinking fully. Despite this criticism, most education systems still weight these scores heavily in their calculations. Consequently, students often spend significant classroom time preparing specifically for these assessments.
Classroom Assessments and Assignments
Regular quizzes, essays, and projects provide ongoing insight into a student’s daily understanding. Unlike standardized tests, these assessments reflect learning as it happens throughout the semester. Teachers can therefore adjust instruction almost immediately based on assignment results. Moreover, this continuous feedback loop helps students correct misunderstandings before they compound into bigger problems. As a result, classroom-based data often proves more actionable than periodic standardized testing alone.
Attendance and Participation
Physical presence in class strongly predicts whether a student will succeed academically overall. Students who attend regularly tend to grasp material more thoroughly than those who miss frequently. Similarly, active participation signals genuine engagement with course content and classroom discussions. Therefore, many performance frameworks assign meaningful weight to these behavioral indicators. Even so, attendance alone cannot fully replace direct measures of academic understanding and skill.
How Schools Calculate These Indicators
Calculation methods vary considerably depending on the institution and its specific educational philosophy. Generally, schools assign percentage weights to each component before combining them into one score. For example, exams might count for forty percent while assignments count for thirty percent. Meanwhile, attendance and participation could make up the remaining thirty percent of the total. Afterward, software systems aggregate this data automatically to generate real-time performance dashboards. Consequently, teachers and administrators can access updated indicators without manual calculation delays. This automation has dramatically improved how quickly schools respond to emerging academic trends.
The Role of Technology in Data Collection
Modern learning management systems now handle most data collection and calculation processes automatically. Platforms track everything from quiz results to login frequency within digital classrooms. Subsequently, this data feeds directly into performance dashboards that update in near real time. Teachers can therefore identify struggling students within days rather than waiting until report cards arrive. Furthermore, parents increasingly access these dashboards directly, improving communication between home and school. As technology continues advancing, these systems will likely become even more predictive and personalized.
Benefits for Students, Teachers, and Parents
These indicators create value for every stakeholder involved in a student’s education. Students gain clarity about their own strengths and areas requiring additional effort. Meanwhile, teachers receive actionable insights that inform lesson planning and individualized support strategies. Parents, too, benefit from transparent, regularly updated information about their child’s academic progress. Because everyone shares access to the same data, communication becomes more focused and productive. Ultimately, this shared visibility fosters stronger collaboration between home and school environments.
Empowering Student Self-Awareness
When students see their own performance data clearly, they often become more motivated learners. Specifically, visible progress toward goals encourages continued effort rather than discouragement or apathy. Additionally, students can identify which subjects need more attention before falling significantly behind. This self-awareness fosters accountability, since students take greater ownership of their own learning journey. Consequently, many educators now share performance dashboards directly with students rather than hiding them.
Helping Teachers Personalize Instruction
Every classroom contains students with vastly different strengths, weaknesses, and learning paces. Performance indicators help teachers group students effectively for targeted, differentiated instruction. For instance, a teacher might create a small group for students struggling with fractions specifically. Meanwhile, advanced students receive enrichment activities based on their own indicator trends. This personalized approach ultimately improves outcomes compared to one-size-fits-all teaching methods.
Challenges and Limitations of Performance Indicators
Despite their usefulness, these indicators are not without meaningful limitations and potential drawbacks. Overreliance on numerical scores can sometimes overshadow creativity, critical thinking, and emotional growth. Additionally, students facing personal hardships might show declining scores unrelated to academic ability. Therefore, educators must interpret data thoughtfully rather than treating numbers as absolute truth. Moreover, poorly designed indicators can inadvertently pressure teachers to focus narrowly on test preparation. This narrow focus sometimes comes at the expense of broader, more holistic education.
Risk of Overemphasis on Testing
When schools weight exams too heavily, teachers may feel pressured to teach toward tests specifically. Consequently, classroom time shifts away from creative projects and deeper conceptual exploration. This trade-off can leave students well-prepared for exams but poorly equipped for real-world problem solving. Educators increasingly advocate for balanced indicators that value multiple forms of demonstrated understanding. Otherwise, the system risks producing test-takers rather than genuinely well-rounded, curious learners.
Equity Concerns in Data Interpretation
Not every student starts from the same academic or socioeconomic baseline unfortunately. Consequently, raw performance comparisons can unfairly disadvantage students facing external challenges outside school. For example, a student without reliable internet access may struggle with digital assignments unfairly. Therefore, equitable systems must contextualize data rather than judging students purely by raw numbers. Without this context, performance indicators risk reinforcing existing inequalities instead of addressing them.
Best Practices for Using Academic Performance Indicators Effectively
Schools that use these tools successfully tend to follow several consistent best practices. First, they combine quantitative data with qualitative teacher observations for a fuller picture. Second, they communicate results transparently with students and parents rather than hiding them. Third, they revisit and adjust their weighting formulas periodically based on new insights. Additionally, successful schools train teachers thoroughly on interpreting data responsibly and ethically. Finally, they treat indicators as conversation starters rather than final, unquestionable judgments about ability. By following these practices, schools maximize benefits while minimizing potential unintended harms.
Combining Data with Human Judgment
Numbers alone rarely tell the complete story about a student’s true potential. Therefore, experienced educators pair data with direct classroom observation and personal conversations. This combination helps distinguish between a temporary struggle and a deeper, ongoing learning gap. Consequently, interventions become more precisely targeted and genuinely helpful for each individual student. Human judgment remains essential, even as data collection tools become increasingly sophisticated and automated.
Regularly Reviewing and Updating Metrics
Educational goals evolve over time, so performance metrics should evolve alongside them. Schools that periodically review their weighting systems catch outdated or irrelevant components quickly. For example, a metric emphasizing memorization might need updating for a more skills-based curriculum. Consequently, ongoing review ensures indicators stay aligned with actual educational priorities and values. This adaptability ultimately keeps the entire assessment system relevant and genuinely useful over time.
The Future of Academic Performance Measurement
Looking ahead, artificial intelligence and predictive analytics will likely reshape how schools measure success. Increasingly, systems will forecast potential struggles before they even appear in traditional grades. Meanwhile, holistic measures involving creativity, collaboration, and problem-solving may gain greater prominence. As a result, future indicators will probably look quite different from today’s exam-heavy models. Nevertheless, the core purpose will remain unchanged: helping students reach their fullest potential. Ultimately, the goal has always been supporting genuine learning rather than simply generating numbers.
Conclusion
An Academic Performance Indicator serves as far more than a simple grade on a report card. Instead, it functions as a comprehensive tool for understanding, supporting, and guiding student growth. When schools use these indicators thoughtfully, they empower teachers, motivate students, and inform parents effectively. However, success depends on balancing quantitative data with genuine human insight and compassion. As education continues evolving, these measurement systems will undoubtedly grow more sophisticated and personalized. Ultimately, their true value lies not in the numbers themselves, but in the actions they inspire.